Demiurge (noun): a Platonic subordinate deity who fashions the sensible world in the light of eternal ideas.
Merriam-Webster Online Dictionary
It’s a very good word; I was quite pleased when I learned of it. The idea of a demigod whose responsibility is to shape the world — not as a creator, or at least not an absolute one, but as a craftsman — was exactly what I needed. You see, I discovered this word while I was looking for a good name for my newly-created “world building” software. The more I thought about the name Demiurge, the more perfect I realized it was.
The Demiurge Project is a collection of software utilities for producing detailed geographical information about places that don’t really exist. I built it to help me create the setting for my upcoming novel. Broadly speaking, Demiurge allows people interested in fiction — writers, readers, and anyone else studying a fantastical setting — to create the kinds of maps and analyses that could only be otherwise obtained if Gandalf had satellite imagery.
This blog post is the first in a series about Demiurge. Later posts will get a little technical as I go into detail about capabilities and techniques, but my goal will always be to keep the series as accessible as possible. My audience, I hope, will not just be engineers, but also writers, readers, artists, and anyone else who has an eye to study world-building.
Motivation
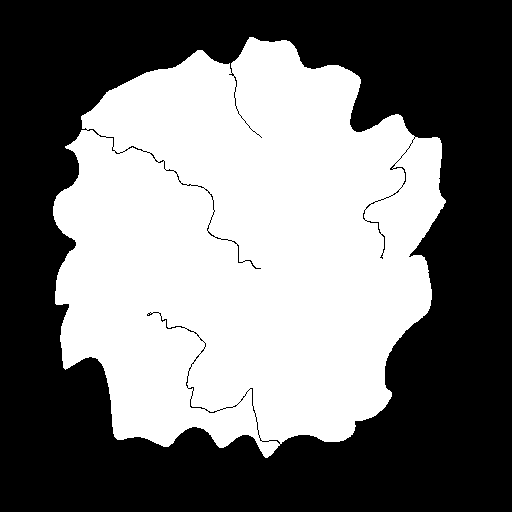
The reason I created Demiurge was to, quite literally, fill in the gaps. Consider the following map.
Hardly worth calling a map, really. This sketch, the work of mere seconds in Microsoft Paint, is nothing more sophisticated than a few squiggles and blotches of black and white suggesting land, sea, and a handful of rivers. But as crude as this is, all of my earliest fantasy maps were far more closely related to this than to real-world cartography. Maps like these are more like globes than maps. Globes are helpful if you want to understand, in a very general way, where enormous things are in relation to other enormous things. But in the real world, maps — topographical maps, resource maps, road maps, population maps — are made to serve a particular purpose. I didn’t need real maps because I didn’t have a particular purpose at first; I just wanted to understand, in a very general way, the layout of the world. It was my characters who first urged me to think more critically about the gaps.
Look again at that map above. How big is that landmass? How long are those rivers? If you were trying to travel from one side of that island to the other, what route would you choose and how long would it take? It was this last question that finally convinced me there was a problem; one of my characters asked something similar, and I was stunned to realize I didn’t have a good answer for him. Of course, I could have just “made something up” and moved on, but I knew this wouldn’t be the last time my characters would want to know something like this. These characters live in a medieval-inspired wartime setting, and knowledge of the world around them would be crucial not just for success, but for survival.
I could probably write an entire post (and maybe I’ll do so) about why I chose not to just “make up” the answers. After all, technically I ended up doing that anyway; I just used a complicated, custom-made tool to inform my imaginings. The bottom line is that I wanted my characters to live in their world in a very deep way; and for that to happen, their perspectives and decisions needed to be informed by a detailed, coherent, and consistent understanding of the world. These characters are the kinds of people who use real maps, even when they don’t actually have them. They pore over details, double- and triple-check their decisions, and treat every dangerous situation like the potential story-ender it is to them. In order to fairly represent these characters, I needed to see the world as they saw it; and to do that properly, I needed to fill in the gaps.
Purpose
A moment to address a misconception. A few times, upon hearing about Demiurge, people have asked me why I would want a piece of software that would just “create the fantasy world for me.” There’s a concern, I think, that using powerful tools limits a creator’s agency; the tool, somehow, is ascribed some of the credit that should have gone to the creator. While I understand this concern and I agree that there are cases where this sometimes happens, I don’t think it applies here. No tool can create your fantasy for you, and if you approach Demiurge hoping for such a tool, you will be disappointed. Demiurge works to help you visualize your own creative decisions (specifically geographical ones) by rendering plausible interpretations of the details that you provide.
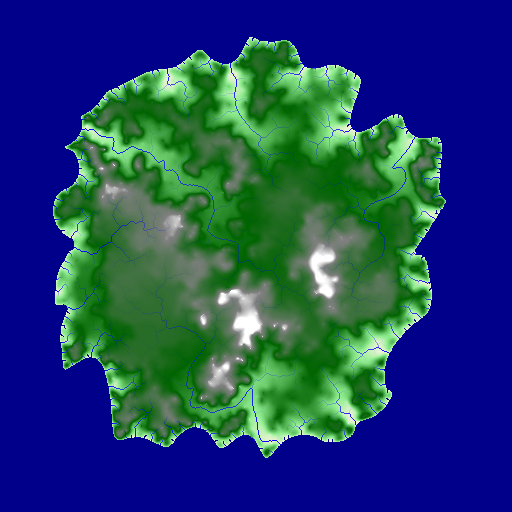
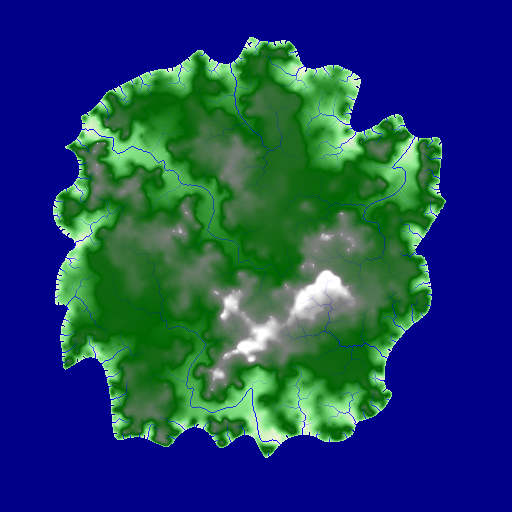
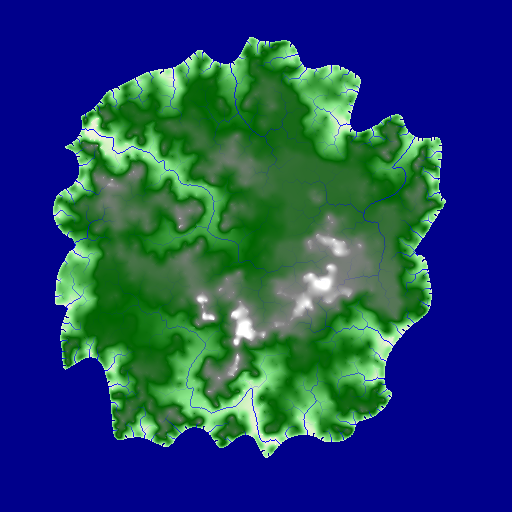
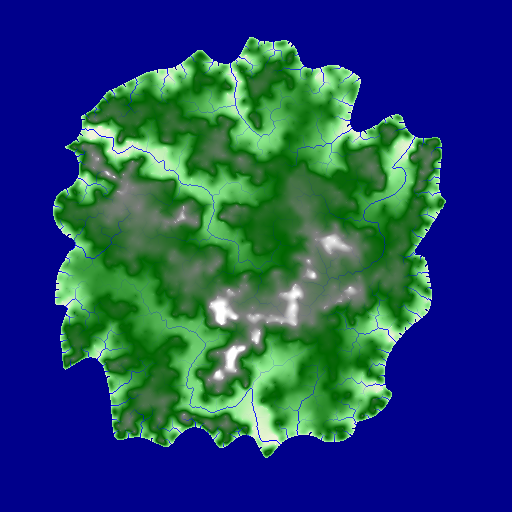
Take another look at the two map images above. The colored map is a valid interpretation of the black-and-white map: the coastline is correct, all four of the original rivers are present, the elevations are reasonable, and every part of the island has at least one way for rainfall to flow out. The same can also be said about all three of the following.
Each one of these maps represents a single, concrete rendering which does not contradict the black-and-white map given as input. To generate these, all I have to do is change a single value — a random seed — and rerun an automated process, and voila! Out comes a meaningfully different interpretation that demonstrates, but does not specify, what the world represented by my map might look like in more detail.
That, I think, is the crucial takeaway: the output of Demiurge is not your fantasy map, the input is. Demiurge merely provides a way to easily visualize reasonable interpretations of your map and to follow up on what those interpretations would imply. The generated maps aren’t by any means definitive, and they aren’t intended for readers (though you theoretically could use them that way). The outputs are conjectures, and they only exist to help you.
So if you want to know how large your fantasy map is, you can set a pixel scale and estimate it. (The map above shows around 45,000 square miles of landmass, slightly larger than Iceland.) If you want to make a claim about the length of the map’s longest river, Demiurge can give you some ideas. (The river systems above vary by map, but the longest rivers average a length of around 200 miles.) If you say in your book that it took someone twelve days to walk from one location to another, Demiurge cannot tell you whether that did or didn’t happen. But it can help you generate five plausible renderings of your world; and if every time you find that the journey would take 18 to 24 days, that might help reveal a potential contradiction between some of your narrative elements. Perhaps your story and your map don’t quite agree about how big the world is. Or perhaps there’s a river that you can just specify on your map, carving a more direct path for your characters to follow. Or perhaps you decide that it really was such a long journey, and your characters were just bookin’.
What you do with the information is up to you; Demiurge is an engine of interpretation, not creation. But it can be useful to generate a cohesive, visual representation of what your world might look like. Looking at such things can offer perspective, and running tests/simulations on postulated topographies can help validate that creative choices aren’t at odds with each other. Looking at detailed maps can also be a great way to spot new opportunities and come up with ideas, or to get inside the heads of strategically-minded characters. And, finally, seeing your sketch-like map visually brought to life — imprecise and non-definitive as that life might be — is just plain fun.
Capabilities
My intention from the beginning was that Demiurge should be usable by everyday people with everyday skills and everyday tools. If you give an everyday person a pencil and a piece of paper and ask them to draw a map, overwhelmingly what you’ll get is something like the black-and-white image shown earlier in this post. Sometimes people will indicate mountains and forests and so on, but only in a very general way. The best you could reasonably hope for from someone without specialized cartography skills is a sort of “biome map” that gives broad, nonspecific indications of what kind of terrain goes where.
Demiurge is designed to take exactly that sort of sketch and generate detailed interpretations of it that adhere to three rules: input conformity, hydrological plausibility, and scalability. Input conformity just means that the user’s word is law. No matter how bizarre the inputs may seem, Demiurge must find a way to make plausible maps that conform to them. Hydrological plausibility means that water behaves the way we expect it to (based on real-world hydrology). Waterways can never flow uphill. From any given location, precipitation must always have a reasonable way to flow out. Rivers are allowed to form relatively unconstrained courses, but the result must always look, broadly speaking, like the sorts of river networks we see in the real world. And finally, scalability means that Demiurge should be able to render maps of theoretically any size at theoretically any scale. In other words, I should be able to use the same technology to generate anything from Aruba to Australia, and I should be able to output maps as coarse as 1000m per pixel or as fine as 1m per pixel.
Using these inputs and rules, Demiurge can produce a variety of outputs that reveal different information about the generated world. The colored maps above are perhaps the simplest and least useful of these; they’re just a direct rendering of the input-scale hydrological map recolored to “look pretty.” Other outputs look much more bizarre but are vastly more useful, like this rendering of the fully-populated river map color-coded by drainage basin.
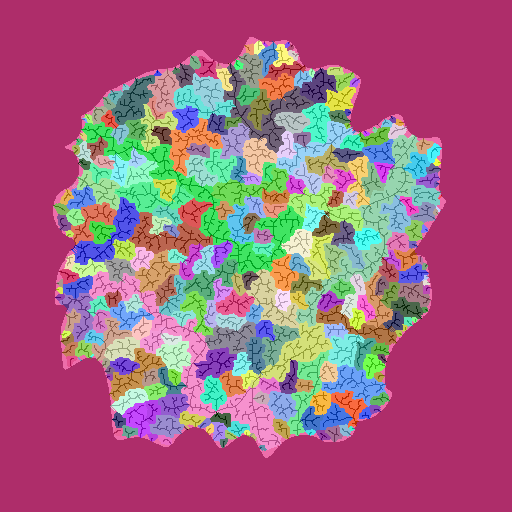
Does this look weird? Well, I think it looks awesome. This is just a convenient visualization of the much-more-important underlying data. For a given postulation of the world, Demiurge can tell you every location of every point on every tributary of every river system. Moreover, it can tell you things like the river’s estimated elevation, grade, width, and flow volume. Though it’s not supported at the moment, you could even add things like water temperature, mineral content, pollution…
Just talking about the possibilities gets me excited all over again. I hope you also find this exciting rather than boring — procedural technology is something of an acquired taste — but I love this stuff. I had to stop myself when I wrote this software from getting sidetracked implementing cool features I didn’t need.
But I did permit myself one deviation into the fun-but-unnecessary. Once I finally got the fine-scale map generation working, I wanted to see it in 3D. Strictly speaking, I didn’t need that — I already had all the information I needed at that time — but after literally months of weekend work to develop the system so far, I felt like I could spare a few days just to let myself “see it for real.”
And damn, those few days were worth it.
The rendering above is interactive; click-and-drag to pan and scroll to zoom. Try it out for yourself!
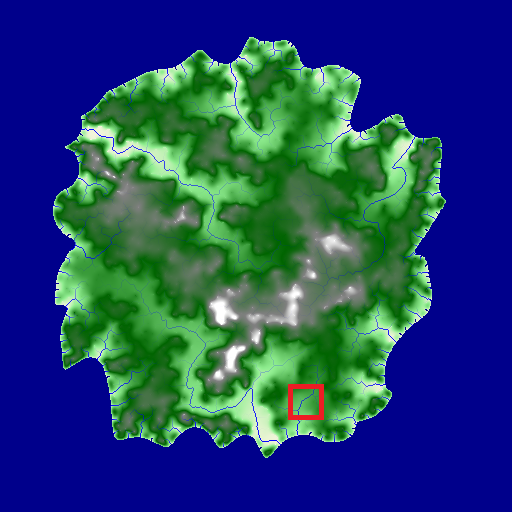
What you’re looking at here is a false-color 100-meter-scale 3D representation of a chunk of the map generated from the original black-and-white input. The region represented roughly corresponds to the area in the red box shown to the right. Please ignore the few visual foibles (disconnected rivers, strange color choices, etc.); this rendering was created to be informative, not flawless. Also, bear in mind that this is just one chunk of the output produced by Demiurge for this input. I have a folder here with 147 other 3D files which, put together, comprise a complete and contiguous representation of this roughly 45,000 square mile island.
45,000 square miles is a respectable size — roughly 250 miles across, or slightly under a month of dedicated travel at a reasonable trekking speed — but it’s by no means all that Demiurge can handle. The renders shown here were all done expressly for this post, and it took about an hour and a half to fully render the 3D representation of the island. The largest rendering I’ve ever done was of a 200,000+ square mile landmass, roughly comparable to Madagascar. That one produced over 2.3 gigabytes of raw topographical data alone (no 3D files), and the process needed three days to run.
There are a thousand other features I want to add to Demiurge someday: I want to improve support for small lakes, I want to think about glaciers, I want to postulate settlement locations, populations, migration patterns… Like I said, I had to stop myself. I created Demiurge for a purpose, and I needed to make sure my investments in it were proportional to the problems it was solving.
But despite the fact that I don’t need anything else from Demiurge right now and I only stopped actively working on it because it succeeded, I have to admit that I’ve missed this. It’s been well over a year since I made a real contribution to the codebase, and writing this blog post has felt like visiting an old friend. Future blog posts about Demiurge will likely be much shorter and much more dense, as each will tackle a single technical facet of the terrain generation pipeline. But I hope this post has given you some sense for the ideas and objectives underpinning the Demiurge Project as a whole; and if you’re interested, that context will help keep you oriented in the posts to come.
–Murray

